-
View article
 #Economy
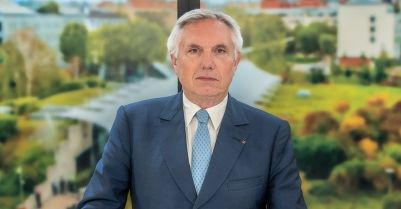
Geopolitics – What the Midterms Won’t Change: the breakdown of political compromise
2026/10/28
Shares and dividend
The share Crédit Agricole S.A. is listed in NYSE Euronext Paris and is eligible for the SRD and the PEA
ISIN Code - FR0000045072 - Mnemonic code - ACA
| Share capital | €9 173 707 035 euros (3 057 902 345 shares in the €3 nominal value) |
|---|
CREDIT AGRICOLE S.A.
15.89€
+0.60%
CAC 40
8,278.59pt
+0.55%
15.79€
Previous closing
16.105€
Opening
16.225€
High
15.885€
Low
6,071,396
Volume traded
-9.487%
Stock variations since 31.12
| Period | variations in % | High | Low |
|---|---|---|---|
| Since 14/12/2001 | -1.76% | €16.88 | €16.17 |
| Since 31/12/2001 | -3.20% | €22.78 | €12.42 |
| Since 31/12/2002 | 19.76% | €17.57 | €11.58 |
| Since 31/12/2003 | -9.03% | €22.04 | €17.39 |
| Since 31/12/2004 | -22.43% | €25.36 | €18.32 |
| Since 31/12/2005 | -35.28% | €33.34 | €24.58 |
| Since 31/12/2006 | -45.95% | €31.12 | €19.03 |
| Since 31/12/2007 | -25.35% | €21.57 | €6.76 |
| Since 31/12/2008 | 98.56% | €15.66 | €5.90 |
| Since 31/12/2009 | 28.52% | €13.78 | €7.87 |
| Since 31/12/2010 | 67.14% | €12.92 | €3.98 |
| Since 31/12/2011 | 264.33% | €6.56 | €2.84 |
| Since 31/12/2012 | 161.09% | €9.50 | €5.95 |
| Since 31/12/2013 | 70.71% | €12.22 | €9.14 |
| Since 31/12/2014 | 47.63% | €14.48 | €9.82 |
| Since 31/12/2015 | 46.00% | €12.07 | €6.79 |
| Since 31/12/2016 | 34.85% | €15.68 | €11.06 |
| Since 31/12/2017 | 15.11% | €15.54 | €9.10 |
| Since 31/12/2018 | 68.45% | €13.40 | €9.10 |
| Since 31/12/2019 | 22.90% | €13.80 | €5.70 |
| Since 31/12/2020 | 53.92% | €13.49 | €9.23 |
| Since 31/12/2021 | 26.57% | €14.27 | €8.09 |
| Since 31/12/2022 | 61.58% | €13.03 | €9.54 |
| Since 31/12/2023 | 23.60% | €15.92 | €12.12 |
| Since 31/12/2024 | 19.53% | €17.78 | €13.10 |
| Since 31/12/2025 | -9.49% | €20.40 | €14.68 |
- 2026/11/10
- 17:36:53
Dividend
The Annual General Meeting of Crédit Agricole S.A. approved on 20 May 2026 the distribution of a dividend of €1.13 per share for the results of 2025, an increase of 3% compared to the previous year.
Performance calculator
Please select a period and the amount invested in Euros or the number of shares purchased.
Analyst coverage
| Firm | Broker |
|---|---|
| Alphavalue | Sylvain Perret |
| Autonomous Research | Stefan Stalmann |
| Bank of America Merrill Lynch | Tarik El Mejjad |
| Barclays Capital | Namita Samtani |
| Citigroup | Azurra Guelfi |
| CM - CIC | Pierre Chédeville |
| Deutsche Bank | Sharath Kumar |
| Exane BNP Paribas | Jeremy Sigee |
| Goldman Sachs | Chris Hallam |
| Intesa Sanpaolo | Alberto Artoni |
| Jefferies | Theo Massing |
| JP Morgan | Delphine Lee |
| KBW | Thomas Hallett |
| Kepler Cheuvreux | Jacques-Henri Gaulard |
| Mediobanca | Matthew Clark |
| Morgan Stanley | Giulia Aurora Miotto |
| Oddo-BHF | Benoît Valleaux |
| Redburn | James Invine |
| Royal Bank of Canada | Anke Reingen |
| UBS | Jason Napier |